Research Article | | Peer-Reviewed

Mathematical Modeling of Bio-Unit System for Oilfield Produced Water Treatment

Received: 12 March 2026     Accepted: 20 March 2026     Published: 23 April 2026
Views:       Downloads:
Abstract

The Nigerian oil and gas extraction faces the challenge of treating excessive co-extracted Produced Water (PW) to fulfil reinjection or disposal specifications. Deploying a proposed modular bio-oxidation system (Bio-Unit) to treat PW necessitates predictive model for this biotreatment process. Thus, this work aimed at formulating mathematical models for predicting and simulating the Bio-Unit system. Experimentally determined biokinetic coefficients and other operating parameters were incorporated into the developed models and integrated numerically using fourth-order Runge-Kutta algorithm. Model predicted values of outlet chemical oxygen demand (COD), total organic carbon (TOC), and bioagent suspended solids (MLSS) were 14.7 mg/l, 7.02 mg/l, and 3252.0 mg/l, respectively. The percentage deviation of model predicted values from measured values was 4.3%, 3.1% and 7.9% for COD, TOC and MLSS, respectively. Linear regression between measured values and model predicted values gave the best fit value (R2) of 0.9923, 0.9890, and 0.9831 for COD, TOC, and MLSS, respectively, which indicates that the formulated model had a significant correlation with the Bio-Unit data and is 99.2%, 98.9%, and 98.3% dependable in predicting the parameters. The mean bias error for predicted MLSS, COD and TOC concentrations were -3.67, 4.79 and 3.24, respectively, which indicates that the model under-predicted the MLSS, while the COD and TOC concentrations were over-predicted. Model simulation showed that biosolid retention time of 21 days and hydraulic retention time of 1.0 day resulted in 98.3% and 98.5% COD and TOC removal. Hence, the formulated models are adequate and recommended for predicting and optimizing the Bio-Unit system.

Published in American Journal of Chemical Engineering (Volume 14, Issue 2)
DOI 10.11648/j.ajche.20261402.12
Page(s) 29-44
Creative Commons

This is an Open Access article, distributed under the terms of the Creative Commons Attribution 4.0 International License (http://creativecommons.org/licenses/by/4.0/), which permits unrestricted use, distribution and reproduction in any medium or format, provided the original work is properly cited.

Copyright

Copyright © The Author(s), 2026. Published by Science Publishing Group

Keywords

Biotreatment, Chemical Oxygen Demand, Modular Bio-Oxidation System, Oilfield Produced Water, Total Organic Carbon

1. Introduction
Oilfield operations generate a tremendous volume of produced water (PW), characterized by the variable waft and composition of poisonous organic and inorganic chemical substances, excessive salt content material, and dissolved solids . While this unsafe waste stream is inevitable in all stages of the oil production life cycle, beginning with exploration to drilling, production and abandonment , most oil and gas wells in the Niger Delta location of Nigeria are now in their secondary and tertiary oil production levels, which has resulted in increased water content of more than 85% in the crude oil produced.
The daily management of PW, through source reduction technologies, injection into the non-producing reservoir or disposal to the environment after physicochemical treatments, poses challenges and operational cost to oil and gas producers , because PW trajectory from these oil/gas wells is growing persistently and environmental permissibility for PW is getting stricter. Injecting PW into abandoned and none producing reservoirs/wells is inadequate, because these none producing reservoirs/wells cannot accommodate the huge volume of PW generated. Physicochemical methods of treating PW may primarily remove dispersed oil but not dissolved petroleum hydrocarbons which are major threat to ecosystem .
Different PW treatment innovations have emerged in recent times . Some hybrid adsorption technologies and novel adsorbents have been studied . Dai et al. used combined fiber coalescence technology to achieve 98.2% removal of oil, and 70% removal of suspended solids from PW. Dawery et al. investigated the removal of organic pollutants and metals from PW using prepared activated carbon prepared from sewage sludge, activated with chemicals, and reported 99.5% removal of pollutants, while the pure sewage sludge had 95.2% removal of pollutants. Akinsete et al combined banana peel and chemically modified activated carbon of Luffa cylindrica as bio-adsorbent to treat PW from Niger Delta oilfield and reported that the biosorbent reduced the heavy metals in the PW below regulatory standards. Similarly, Udeagbara et al. combined four bio-adsorbents (orange peels, banana peels, sponge gourd i.e., Luffa cylindrica, and palm kernel fibers to treat PW from Niger Delta oil fields and reported that the combined biosorbents achieved high percentage removal of heavy metals in the treated PW. Oyedoh and Adam-Urete studied the removal of total hydrocarbon content (THC) from PW using activated cow bone carbon as biosorbent and reported that biosorbent removed high quantity of THC from the PW. PW treatment using adsorption technology is energy consuming due to fluid transport via the feed to the media .
Studies have been conducted on the use of coagulants for PW treatment. Das et al. investigated PW treatment using chemical coagulants (aluminum potassium sulphate, sodium sulfide, ferric chloride, magnesium oxide, and chitosan) and reported that these coagulants efficiently reduced the PW pH, turbidity, salinity, total suspended solids (TSS), and total dissolved solids (TDS). Odisu and Basikoro evaluated the efficiency of PW treatment using plantain pseudo stem juice as bio-coagulant, instead of aluminum sulphate and reported that the bio-coagulant can efficiently remove TSS, TDS, and turbidity from PW. Zolghadr et al. reviewed the conventional and hybrid membrane technology for PW treatment. Guo et al. evaluated PW treatment using combined ultrafiltration-reversed osmosis (UF-RO) technique and reported 97.5% chemical oxygen demand (COD) removal efficiency. Other technologies such as the advanced oxidation processes (AOP) have been viewed as a promising technology for PW Treatment. Zhanga et al. reported that AOPs exceeded 90% removal of COD and can treat recalcitrant pollutants.
Though the previously mentioned PW treatment innovations can decontaminate PW to reusable or disposable standards, they have challenges on operability, maintenance, and secondary waste stream . While the usage of aforesaid biosorbents is not sustainable because they need to be replaced regularly and may not be readily available, chemical coagulants are very expensive, thus increasing operational expenditures (OpEx). AOPs has the demerit of generating harmful byproducts and has high OpEx. Membrane technology has the challenge of membrane fouling and clogging, which necessitates regular cleaning or replacement, thus increasing OpEx.
The biological method is considered as more efficient and less cost PW treatment choice . Most dissolved organic compounds in the PW can be biodegraded provided proper microbial consortia is established, maintained, and controlled. The import of engaging plethora of microbial species with the appropriate metabolic capabilities in degrading petroleum hydrocarbon contaminants in any given environment, be it natural or engineered system have been studied . Various biotreatment options for PW handling have been reviewed . Alsarayreh et al. reviewed PW treatment using microalgae and reported that algal based technology can effectively decontaminate PW. Tellez et al. investigated the oilfield PW treatment using a continuous flow activated sludge system and reported that the system removed 98 – 99% total petroleum hydrocarbon (TPH) from the PW. Kardena et al. investigated the treatment of synthetic oilfield PW using activated sludge system and reported that the system achieved 80.7% and 82.4% removal of COD at solid retention times of 25 and 20 days, respectively.
Advances in activated sludge systems include sequencing batch reactor (SBR), which is emerging as a viable technology for biotreatment of PW, due to its small footprint and flexibility. Pandashteh et al. investigated the pretreatment of synthetic and real produced water in a SBR and disclosed that the removal rates of COD, total organic content (TOC) and oil and grease (O&G) content for the real produced water were 81%, 83% and 85%, respectively. Also, the options of using SBR system as a standalone or in synergy with physicochemical methods have been explored. Fakhru’l-Razi et al. investigated the treatment of oilfield PW using a membrane SBR (MSBR) and a combined membrane SBR and reverse osmosis (MSBR/RO). They reported that the combined methods (MSBR/RO) had high removal efficiency, though there was membrane fouling. Khairuddin et al. studied PW treatment using semi-continuous SBR and microalgae photobioreactor and reported that the processes showed 64% and 49.8% removal of TOC and TDS, respectively. Nwokoma and Dagde explored the viability of treating oilfield PW using a modular Bio-Unit system, which is operated as a fill-and-draw activated sludge process and reported that the system efficiently removed 98.5% and 97.6% of TOC and COD, respectively, from the PW.
Mathematical modeling is necessary to optimize the factors influencing bio-oxidation efficiency in wastewater treatment facilities . Untreated or partially treated PW contains harmful substances that pollute the ecosystem. Thus, the motive of this research is to ensure that the PW discharged into the environment is safe to fauna and flora of the oil and gas-bearing communities. This can be achieved through economic and ecofriendly technology that leverages biosystem modeling and optimization. Having previously evaluated the performance of the modular Bio-Unit system , the aim of this present work is to formulate mathematical models for predicting the bioprocesses and effluent PW quality (COD and TOC) of the modular Bio-Unit system. Formulating a fit-for-purpose model, from first principle of mass balance incorporated with biokinetics and stoichiometric coefficients gotten from the pilot scale Bio-Unit system, will enable system automation for operational control. The simulation of the formulated models will enable versatility and optimization of the bioprocess, and selection of operating strategies for achieving treatment objectives within a lean organizational budget. Also, it will aid in designing, operating, and controlling other related biological systems.
2. Materials and Methods
2.1. Materials: Description of the Modified Produced Water Treatment Unit
A nearshore crude oil processing terminal located in Niger Delta region of Nigeria receives and process crude oil from various wellheads. The crude oil comes with PW that needs to be treated before disposal to the estuary. The facility has a Produced Water Treatment Plant (PWTP), based on physicochemical methods (corrugated plate interceptors, induced gas flotation, and skimmers and disposal basins). The rectangular concrete PW disposal basins were modified into a fill-and-draw bio-oxidation basins (Bio-Unit) as shown in Figure 1. Microbial consortium occurring naturally within the crude oil saver pit was harvested and acclimated in the Bio-Unit system. Aeration was done using an air instrument from the oil production facility. The characteristics of the oilfield PW sample, the operation and operating parameters of the retrofitted PWTP were reported by Nwokoma and Dagde , and Nwokoma et al. . The modification of the existing PW disposal basin into a compact biotreatment system as indicated by the broken red line, the locally harvested bioagents, and the instrument air from the facility make the modular Bio-Unit system cost effective and retrofittable into the extant PWTP.
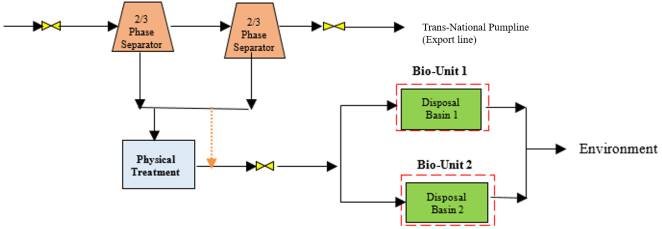
Figure 1. Extant PW treatment retrofitted with modular Bio-Units system.
2.2. Methods
2.2.1. Mathematical Modeling of the Bio-Unit System
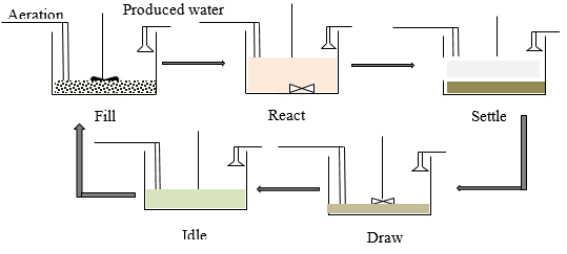
Figure 2. Schema of the aerobic Bio-Unit cycle.
The bio-oxidation unit (Bio-Unit) system operates in a 24-hour aerobic cycle with five distinct steps: Fill (1 hour), React (22 hours), Settle (0.5 hours), Decant (0.5 hours), and Idle (0.25 hours), as shown in Figure 2. The cycle operation attained high percentage removal of COD and TOC under these conditions. The 1-hour filling period characterized high instantaneous loading factor in the Bio-Unit system . The 22-hour reacting period enabled the accomplishment of biochemical reactions of slowly biodegradable hydrocarbons and readily biodegradable hydrocarbons , while the 0.5-hour settling period allows biosolids to be concentrated adequately in the settled volume before decanting. The excess biosolids are decanted into a dewatering bag, drained, dried and reused for soil enrichment.
The prime purpose for developing these models is for prediction and control of the bio-oxidation processes occurring in the Bio-Unit system. Thus, for avoidance of ambiguity, the model formulation assumed that the carbonaceous substrate that is divided into slowly and readily biodegradable substrates in ASM1, is only one state variable, measured in terms of chemical oxygen demand COD (SCOD), which is a measure of available electrons. Quantifying the carbonaceous material in terms of a single variable (SCOD), provides a reliable basis for describing the Bio-Unit process and enables mass balances to be performed on the system on a standard scale. In PW characterization and bioenergetics of microbiological consortium, the hydrocarbon pollutants are quantified in terms of lumped electron donating capacity which is measured as COD or TOC, though there may be slowly biodegradable hydrocarbons and recalcitrant organics. The hydrolysis of the slowly/recalcitrant biodegradable substrate is a very complex reaction, thus combining the readily biodegradable and slowly/ recalcitrant biodegradable fractions together makes mathematical modeling of such processes cumbersome. Also, it is difficult to measure the slowly biodegradable hydrocarbons and readily biodegradable hydrocarbons individually. Kinetic rate expressions for the removal of carbonaceous materials (SCOD) and the microbial growth are described by Monod Equation. It is also assumed that bioconversion activities occur only during Fill and React periods, and aerobic conditions exist throughout the Fill (Mixed /Aerobic filling) and React periods. The experimental results have shown that COD and TOC reduction during the other periods (Settle, Decant and Idle) are very negligible . These other periods mainly serve for liquid-solid separation and excess biosolids wasting and stabilization.
The mass conservation law defining the Bio-Unit system is articulated as follows:
Accumulation Rate=Input Rate-Output Rate+Generation-Consumption Rate(1)
Which is translated mathematically as:
d(VC)dt=qinCin-qoutC±VrC (2)
where: V = reactor volume (l), t = time (h), C = time varying concentration of component of interest (mg/l),
Cin = inlet concentration (mg/l), q = flow rate of component, (l/h), qin = inlet flow rate (l/h), qout = outlet flow rate (l/h), rC = reaction rate of the component.
Applying the product rule of differentiation to Eq. (2), dividing across by V, and re-arranging gives:
dCdt=qinVCin-qVC-qoutVC±rC (3)
2.2.2. Bio-kinetic Models
The net rate of generation or consumption of a given component rCI, is expressed as:
rCI=IϑCIjρj(4)
where: rCI = net rate of generation/consumption of component I, (mg/l.h), ρj = net expression for process j, mg/l.h, ϑCIj = Stoichiometric coefficient relating process j to component I.
The dynamic behaviour of bioagents concentration, which is affected by aerobic growth and decay, is given as follows:
rXh= μm,h SCODKSCOD+SCOD-bhXh(5)
where: rXh = rate of reaction for bioagent, Xh = Bioagents concentration (mg/l), SCOD = Substrate (COD) concentration (mg/l),
μm, = Maximum specific growth rate of bioagents (mg/l), KSCOD = Substrate (COD) saturation coefficient (mg/l), bh = Decay coefficient for bioagents (1/h).
The rate of reaction (rSCOD) describing the degradation of Substrate (COD) by the bioagents in aerobic conditions is given as:
rSCOD= -μm,h YSCODKSCOD+SCODXh(6)
where: Y = Bioagents yield (mgXh/mgSCOD).
Having assumed that biochemical reactions occur only in the Fill and React stages, thus appropriating Eq. (3) to each of these periods in the Bio-Unit cycle will hold as follows:
For the Fill period:
During the Fill period, biochemical reactions occur in a reactor volume that progressively increases from the initial volume V0 to the total volume V, which can be defined as:
Time interval: 0<t<tfill
V= V0+0tfillqdt(7)
V= V0+qt(8)
where: t = time (hr), tfill = Filling time (hr), q = volumetric flow rate
Professing that there is no component flowing out (qoutV=0) during the filling period and assuming a constant flow rate (qI,in=q), the mass balance for each element is expressed from Eq. (3) as:
dCIdt=qVCI.in-CI+rCI(9)
Eq. (9) is the generalized mass balance for the components in the Fill period of the Bio-Unit system, from which the mass balance for the individual components can be formulated. Thus, the mass balance for the bioagents from Eq. (9) is given as:
dXhdt=qVXin,h-Xr,h+ rXh(10)
where: Xr,h = returned biomass.
Xin,h Xr,h, thus Xin,h is assumed = 0, so Eq. (10) by re-arrangement becomes:
dXhdt= rXh- qXr,hVXh (11)
Substituting for rXh from Eq. (5) into Eq. (11) gives:
dXhdt= μm,h SCODKSCOD+SCOD-bh-qXr,hVXh(12)
Where the biosolids retention times (θc), which is the estimated time for the bioagents to be retained in the bioreactor before being wasted, is expressed as:
θc=VXhqXr,h(13)
However, for the Bio-Unit, a discontinuous activated sludge bioreactor, the PW flow rate, q, and the bio-solid wastage flow rate must be defined in terms of the total volume processed and wasted per day, respectively. Therefore, the effective biosolids retention times (τ) for the Bio-Unit system, which is the estimated time for the bioagents to be retained in the Bio-Unit multiplied by the fraction of cycle (β) devoted to Fill and React periods, is expressed as:
τ=βθc(14)
Thus, substituting Eq. (14) into Eq. (12) gives:
dXhdt= μm,h SCODKSCOD+SCOD-bh-1βθc(15)
Also, the mass balance for the substrate (COD) is expressed from Eq. (9) as:
dSCODdt=qVSCOD,in-SCOD+rSCOD(16)
The effective hydraulic retention time, HRT (ϑ) for the Bio-Unit system, defined as the reciprocal of the dilution rate (θ) multiplied by the fraction of cycle (β) devoted to Fill and React periods:
ϑ= βθ(17)
Thus, substituting Eq. (17) into Eq. (16) yields:
dSCODdt=1βθSCOD,in-SCOD+rSCOD(18)
Substituting for rSCOD from Eq. (6) into Eq. (19) gives:
dSCODdt=1βθSCOD,in-SCOD-μm,h YSCODKSCOD+SCODXh(19)
Eq. (15) and Eq. (19) are the corresponding mathematical models that explain how the concentrations of bioagents and substrate (COD) in the discontinuous bio-oxidation basin (Bio-Unit) change during the Fill period.
For the React period:
At time interval: tfill<t<treact,
Keeping that there is no component flowing in or out of the bioreactor, wherein the Bio-Unit operates as a thoroughly mixed batch bioreactor system, Eq. (9) will reduce to:
dCIdt= rCI (20)
Thus, the mass balance for bio-agents during the React period is therefore articulated as:
dXhdt=rXh(21)
The mass balance for the readily biodegradable substrate during the React period is given as:
dSCODdt=rSCOD(22)
Substituting Eq. (5) into Eq. (21) and Eq. (6) into Eq. (22) yields:
dXhdt=μm,h SCODKSCOD+SCOD-bhXh(23)
dSCODdt=-μm,h YSCODKSCOD+SCODXh(24)
Eq. (23) and Eq. (24) are the respective mathematical models describing changes in biomass and substrate (COD) concentrations during the React period in the discontinuous bio-oxidation basin (Bio-Unit).
2.2.3. Boundary Conditions for Model Equations
The model equations (Eq. (15) and Eq. (19) for Fill period and Eq. (23) and Eq. (24) for React period) can only be solved using boundary conditions. Therefore, the following boundary conditions hold for the model equations:
(i). Fill Period
At the start of the Fill period, assuming sludge wastage at the end of the React period: Initial conditions: at t=0, C=CI0, i.e., at t=tfill0; Xh= Xh,fill0; SCOD= SCOD,fill0.
At the end of the Fill period, t=tfill, C=CItfill. i.e., at t=tfill, Xh= Xh, fill; SCOD= SCOD,fill
(ii). React Period
Initial conditions for the React period are the same as final conditions for the Fill period (i.e., conditions at the end of the Fill period (at t=tfill, C=CItfill). These initial conditions are at treact0=tfill; Xh,react0= Xh,fill; SCOD,react0= SCOD,fill
At the end of the React period: t=treact, CI=CI(treact). i.e., at =treact; Xh= Xh, react; SCOD= SCOD,react.
2.2.4. Characteristics of the Oilfield PW Sample
The characteristics of the oilfield PW sample which was treated in the pilot scale Bio-Unit system is shown in Table 1 .
Table 1. Characteristics of the oilfield PW sample for the biotreatment .

Parameter

Method

Value

Temperature,°C

In situ Thermometric

30.5 ± 6

pH@ 25°C

APHA 4500-H+B

7.90

Total Dissolved Solids, TDS, mg/l

APHA 2540C

5754.6

Total Suspended Solids, TSS, mg/l

APHA 2540D

280.3

Salinity, (Cl-1, mg/l)

APHA 4500-Cl-B

3645.8

Chemical Oxygen Demand, COD, mg/l

APHA 5220D

582.5

Total Organic Carbon, TOC mg/l

ASTM D7573-18

466.1

The MLSS was estimated by using the AccuCount fluid test method. The MLSS in the PW was extracted from the PW by pouring 20 ml of homogenized PW sample into a syringe barrel having a filter attached to it. The PW sample was slowly pushed through the filter using the syringe plunger. The filter was detached and plunger removed. The filter was re-attached to the syringe barrel and 5 ml of cleaner was added into the syringe barrel and passed through the filter until it was dry. Further drying of the filter was carried out by pushing syringe plunger through empty syringe barrel. 1 ml of the extrantant was added to the syringe barrel and passed through into a new 9 ml diluent tube. The diluent tube was capped and inverted 3 times to mix. 100 µl of sample from diluent tube was drawn using pipette tip into an assay tube. 100 µl of ATP enzyme was added to the assay tube, swirled gently for 5 times and inserted into Luminometer to read off and record the concentration of the MLSS in the assay tube.
The COD was estimated using APHA 5220D. Firstly, the sample was acidified, then vacuum pretreated and prepared for measurement. The DRB200 Reactor power was put on and set to the COD program. 100 ml of sample was blended until homogenized. 9.0 ml of homogenized sample was pipetted into a glass mixing cell. The blank was prepared by m 9.0 ml of deionized water into another glass mixing cell. 1.0 ml of concentrated sulphuric acid was pipetted into both mixing cells, closed tightly, and inverted several times. The mixing cells were allowed to cool to room temperature. Vacuum pretreatment of sample and blank was conducted. The vacuum pretreatment device (VPD) was attached to a vacuum pump capable of creating a vacuum of 20 – 25 inches of mercury. A sample identifier was written on each vial and Mn III COD vials were inserted in the numbered hole in the VPD base. The vials caps were removed and the VPD top was put. A fresh Chloride Removal Cartridge (CRC) was inserted directly above each Mn III COD reagent vial and any open holes in the VPD were closed with stoppers. The vacuum pump was started and the vacuum regulator valve, which is on top the VPD, was adjusted until the internal gauge reads 20 inches of water. 0.60 ml of acidified blank was pipetted into the CRC. 0.60 ml of the acidified sample was pipetted into the other CRC. The vacuum regulator valve was closed completely for 1 min to actualize full vacuum, after which the VPD was moved back and forth several times to remove drops adhered to the CRC. The VPD regulator was turned off and set aside, and the used CRC was disposed. The vacuum pretreated sample and blank were prepared for measurement. The Mn III COD reagent vial was removed from the vacuum chamber, capped tightly, and inverted severally to mix. The vials were inserted in the DRB200 Reactor at 150°C for digestion. After 1 hour, the vials were removed from the DRB200, allowed to cool in a rack for 2 min. The vials were further allowed to cool to room temperature in a cool water bath. The DR 6000 program 432 COD Mn III was started and the blank vial, after cleaning, was inserted into the 16-mm cell holder. The ZERO button was pushed to display 0 mg/l. The sample vial was clean, inserted into the cell holder and READ button was pushed to obtain result in mg/l COD Mn.
The TOC was estimated by using spectrophotometric method (ASTM D7573-18). 25 ml of xylene was added to 500 ml of produced water sample, and the graduated sample bottle was shaken for 5 min. The contents were poured into a separating funnel, allowed to settle, and the extracted TOC in xylene was drained off into a centrifuge tube. The produced water was collected into the sample bottle and another 25 ml of xylene to sample, shaken for 5 min, allowed to settle and extract drain into the centrifuge tube. The extract in the centrifuge tube was spin in a centrifuge machine (at 1500 rpm and temperature of 60°C) for 10 min, thereafter it was poured into a sample cuvette. The cuvette was put into Spectrophotometer (DR 6000), and the absorbance was read off at 425/450 nm wavelength and the concentration at that absorbance read from a standard concentration calibrated graph. The total oil content (TOC) concentration of the sample was calculated as:
TOC=C×V2V1(25)
where: C = Concentration read from the Spectrophotometer (Calibrated graph concentration, mg/l); V1 = Volume of extract, l; V2 = Volume of sample, l.
2.2.5. Operating/Biokinetic Parameters
The operating and the biokinetic parameters for the pilot-scale Bio-Unit process had been experimentally determined as reported in Nwokoma et al. . These parameters as shown in Tables 2 and 3 were used as the inputs for solving the formulated models. The PW temperature (30.5 ± 6°C) suits the Nigerian climate which is mostly tropical with an average seasonal temperature of 21 to 35°C in the Niger Delta region of Nigeria. It is also suitable for microbial activity; the optimum temperatures for microbiological metabolism are between 25 and 35°C .
Table 2. Operating parameters of the pilot-scale Bio-Unit system .

Parameter

Value

Temperature (°C)

30.5 ± 6

pH (-)

7.7 ± 0.2

Dissolved Oxygen (mg/l)

3.8 ± 0.2

Influent COD (SCOD(0)) (mg/l)

582.5

Influent TOC (STOC(0)) (mg/l)

466.1

Initial MLSS (Xh(0)) (mg/l)

1000.0

Hydraulic Retention Time, HRT, (θ) (day)

1.0

Biosolid Retention Time, BRT, (θc) (day)

21

Influent Flow rate (q) (l/h)

625.0

Volume (l)

15000

Cycle fraction for Fill and React Period (β) (-)

0.96

Table 3. Biokinetic parameters used for solving the Models .

Coefficient

Value

Maximum Specific Substrate utilization rate, km (d-1)

0.27

Maximum Specific growth rate, μm, (d-1)

0.24

Half saturation constant, KSCOD (mg COD/l)

16.28

Endogenous Decay Rate, bh (d-1)

0.08

Yield, Y (mg MLSS/mg COD)

0.89

2.2.6. Solution Technique to Model Equations
The model equations, Eq. (15), Eq. (19) for the Fill period, and Eq. (23), Eq. (24) for the React period, which are sets of non-linear first-order differential equations, were solved numerically using the fourth-order Runge-Kutta (R-K) method. Based on this numerical solution technique, a computer program was developed in MATLAB to solve the algorithm.
3. Results and Discussion
3.1. Evaluation of Model Predicted Results with Experimental Results
Table 4 shows the model prediction for COD, TOC, and MLSS concentrations in the treated PW as compared to the experimental data from the pilot-scale Bio-Unit Data .
Table 4. Comparison of model predicted values with experimental values from Bio-Unit.

Time (t)

MLSS (mg/l)

COD (mg/l)

TOC (mg/l)

Fill Period

Predicted

Experimental

Predicted

Experimental

Predicted

Experimental

0

1000.0

1000.0

582.5

582.5

466.1

466.1

1

1172.5

1120.6

277.96

235.4

379.7

349.5

2

1225.1

1202.8

169.62

166,7

321.1

309.1

3

1338.4

1315.3

117.31

123.8

292.1

275.3

4

1496.2

1482.9

101.93

114.3

178.8

212.7

React Period

0

1496.2

1482.9

101.93

114.3

178.8

212.7

1

1861.7

1634.2

110.99

103.2

83.2

95.58

2

2108.5

2210.1

66.97

62.5

51.9

43.72

3

2745.8

2976.7

40.82

37.2

19.6

11.51

4

3252.0

3290.6

14.7

14.1

7.02

6.81

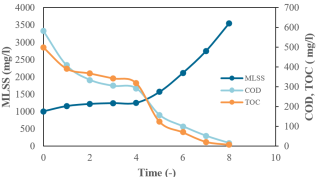
Figure 3. MLSS, COD and TOC concentrations profile for the Bio-Unit cycle time.
Figure 3 depicts the model prediction of the entire aerobic cycle of the Bio-Unit system. It shows that the MLSS concentration increased while the COD and TOC concentrations decreased with aerobic cycle time. It indicates high COD and TOC removal within the Fill (1 hours) and React periods (22 hours). As filling time (tfill) increased from 0 to 1, the MLSS concentration increased from 1000.0 mg/l to 1496.2 mg/l, while the COD concentration decreased from 582.5 mg/l to 101.93 mg/l and the TOC concentration decreased from 466.1 mg/l to 178.8 mg/l. This indicates that a significant biochemical reaction occurred during the aerated Fill period. The React period, which commenced at the end of the Fill period, i.e., at tfill = 1 = tReact = 0, increased the MLSS concentration exponentially from 1496.2 mg/l to 3252.0 mg/l, while the COD concentration decreased from 101.93 mg/l to 14.7 mg/l and TOC from 178.8 mg/l to 7.02 mg/l, while the experimental results from the pilot scale Bio-Unit for effluent COD and TOC were 14.1 and 6.81 mg/l, respectively. It illustrates the high degradation of the targeted pollutants from PW by the bioagents during the 19-hour bio-oxidation period. These trends agree with other published literature . The other periods (Settle, Decant and Idle) play mostly the role of liquid-solid separation and sludge wasting and stabilization.
The acceptable limits stipulated by the Nigerian Upstream Regulatory Commission (NUPRC) for TOC and COD discharged from PW are 10 and 40 mg/l , respectively. The model prediction demonstrated that the treated PW from the pilot scale Bio-Unit system met the TOC (10 mg/l) and COD (40 mg/l) regulatory requirements of NUPRC for inland disposal of PW. The model showed that the modular Bio-Unit system removed 98.5% of TOC, and 97.5% of COD from the PW, while experimental results from the pilot scale Bio-Unit showed 98.5% and 97.6% removal, respectively. This indicates that the models can predict the modular Bio-Unit system performance reasonably. The model predicted values also showed that the modular Bio-Unit system performed comparatively better than the conventional activated sludge system, which Kardena et al. reported 84% COD removal from a synthetic PW, and the fixed bed biological reactor, which Lusinier et al. reported 95% COD removal from synthetic PW.
3.2. Linear Regression Analysis of Model Result
The adequacy and reliability of the model were evaluated by plotting the model predicted values against experimental values from the pilot-scale Bio-Unit System.
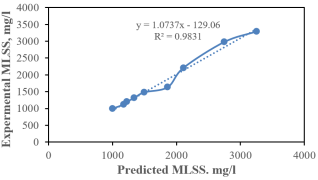
Figure 4. Model predicted MLSS vs experimental MLSS concentrations.
Figure 4 shows the linear regression between the experimental and model predicted values of MLSS. The equation the line, y=1.0737x-129.06, with a best fit value R2=0.9831, indicates that the model is 98.3% reliable in predicting MLSS concentration in the Bio-Unit system, with one data point (1861.7, 1634.2) was under-predicted and one data point (2745.8, 2976.7) was over-predicted.
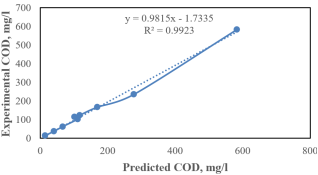
Figure 5. Model predicted COD vs experimental COD concentrations.
Figure 5 shows the linear regression between experimental values from the pilot scale Bio-Unit system and model predicted values of COD. The equation of the line, y=0.9815x-1.7335, with a best fit value (R2)=0.9923, indicates that the developed model is 99.2% reliable in predicting COD concentration in the Bio-Unit system, though one data point (277.96, 235.4) was under-predicted, another data point (101.93, 114.3) was over-predicted.
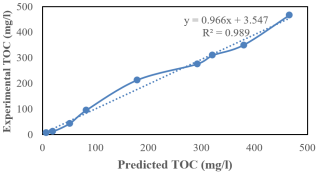
Figure 6. Model predicted TOC vs experimental TOC concentrations.
Figure 6 shows the linear regression between experimental values from the pilot scale Bio-Unit system and model predicted values of TOC. The equation of the line, y=0.966x+3.547, with a best fit value (R2)=0.989, which indicates that the formulated model is 98.9% reliable in predicting TOC concentration in the Bio-Unit system, with two data points (83.2, 9.58) and (178.8, 212.7) were over-predicted.
The mean bias error (MBE), which quantified the average bias within the model prediction was calculated as:
1ni=1nxi-yi(26)
The percentage deviation of the model prediction from the pilot scale Bio-Unit data was calculated as:
% deviation=xi-yiyi×100(27)
Table 5 shows the MBE, percentage deviation of the model predicted values from the pilot-scale Bio-Unit data.
Table 5. Comparison of model predicted value with experimental values from the pilot-scale Bio-Unit.

Component

Bio-Unit Experimental value (mg/l)

Model Prediction (mg/l)

Correlation Coefficient (R2)

MBE

%Deviation

MLSS

3290.6

3252.0

0.98

-3.67

7.9

COD

14.1

14.7

0.99

4.79

4.3

TOC

6.81

7.02

0.99

3.24

3.1

The mean bias error (MBE) for the MLSS concentration prediction was -3.67, which indicates that the model under-predicted the MLSS concentration in the Bio-Unit system, while the MBE for COD and TOC concentrations were 4.79 and 3.24, an indication of over-prediction. The percentage deviation of the model values from the experimental values is 7.9%, 4.3% and 3.1% for MLSS, COD and TOC, respectively. This shows that the model prediction agrees reasonably with the experimental data from the pilot-scale Bio-Unit. The deviations could be attributed to the dynamic behaviour and hydraulic complexity associated with discontinuous bioreactor systems. It could also result from biological or physicochemical factors such as an underestimation of the endogenous decay rate (bh) used in the model, and/or the removal of volatile organics through physical stripping during the intense aeration phase.
3.3. Model Simulation of Operational Parameters
The models were simulated to investigate the effects of critical operational parameters, namely, the biosolid retention time BRT, hydraulic retention time HRT, initial MLSS and COD concentrations on the performance of Bio-Unit. The hydraulic and bioagents durations in the bio-oxidation system influence biotreatment efficiency of wastewater. Also, ascertaining the actual BRT and HRT will prevent partial bio-oxidation, aid provision of desired microbial growth, and guide in selecting optimal operating envelope. Thus, these parameters are vital for the designing of bio-systems for oilfield PW treatment.
3.3.1. Effect of Biosolid Retention Time on the Performance of the Bio-Unit System
The model was simulated for BRT 3, 9, 15, 21, and 27 days, while the HRT and MLSS were kept constant at 1 day (24 hours) and 1000 – 1460 mg/l, respectively.
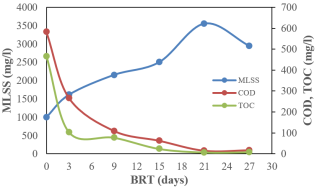
Figure 7. Effect of BRT on the performance of the Bio-Unit system.
The effect of BRT on the Bio-Unit efficiency as illustrated in Figure 7 shows that COD and TOC concentrations decreased with an increase in BRT, while the MLSS increased with an increase in BRT. The simulation revealed that COD and TOC percentage removal were 54%, 81.3%, 89.3%, 98.5%, 98.3% and 77.8%, 83.4%, 94.9%, 98.5%, 98.3%, respectively for BRT 3, 9, 15, 21 and 27 days. The simulation indicated that 21 days BRT was the optimum conditions for attaining COD and TOC concentrations of 14.7 mg/l and 7.02 mg/l by the Bio-Unit system. This agrees with the pilot scale Bio-Unit system, which has been shown to perform efficiently at 21 days BRT and Kardena et al. which reported that, for 25 and 20 days of BRTs, 80.7 and 82.4% of COD were removed from PW treated by the activated sludge system. Similarly, Tellez et al. reported that high percentage COD was removed in 20 days BRT. The 21 days BRT correlated with high performance of the biotreatment of the oilfield PW, because it enabled adequate microbial acclimation, increased biodiversity of the active biomass, resulting in a wider range of biodegradation pathways, increased oxygen transfer rates, improved biomass particle size distribution and additional removal of emerging contaminants . BRT controls the density of biosolids, balancing the microbial consortium growth rates against biomass wasting rate. Though, it was reported that long BRT could negatively impact the aerobic digestibility of activated sludge by increasing the fraction of non-biodegradable sludge , encourage the growth of multicellular higher order microbial predators that can feed on sludge flocs and increase turbidity by the presence of decaying remains of sludge flocs . Therefore, an optimum BRT exists, predicated from a compromise between the gains and losses in the various cost terms. The implication of increasing BRT above 21 days as envisaged by the simulations, is that there would be insignificant organo-pollutants removal, due to decreased in the biomass active fraction, and microbial decay. Also, more oxygen will be used, since oxygen consumption rate increased with BRT because of higher endogenous respiration needed , thereby increasing operational cost of PW treatment. It thus suggests that the BRT should be adequate to necessitate ample microbial concentration for optimal bioconversion of the PW, but should not exceed 21 days, to avoid efficiency nose-diving and process dis-economics.
3.3.2. Effect of Hydraulic Retention Time on the Performance of the Bio-Unit System
Hydrodynamics has direct influences on the effectiveness of a biological treatment system. The hydraulic retention time (HRT) which is the estimated time a specific volume of wastewater in retained in the working volume of a bioreactor, is pivotal in preventing unfavourable metabolic activities and maintaining a control of biomass concentration.
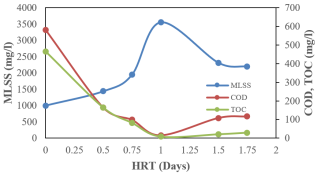
Figure 8. Effect of HRT on the performance of the Bio-Unit system.
HRT influences effluent quality because it correlates the organic loading, biosolids growth, and organo-pollutant degradation. The simulation to analyze the effect of HRT on the Bio-Unit system efficiency was carried out for HRT of 0. 50, 0.75, 1.00, 1.50 and 1.75 days, while the BRT, and MLSS were kept constant at 21 days, 1000 – 1460 mg/l, respectively. The result as depicted in Figure 8 illustrated that, for HRT of 0.50, 0.75, 1.00, 1.50, and 1.75 days, the effluent COD were 163.9, 98.0, 14.7, and 108.1 mg/l respectively, while the effluent TOC were 163.9, 81.5, 7.02, 19.9, and 28.5, respectively, and the effluent MLSS were 1437.5, 1944.9, 3552.0, 2312.9, and 2194.1 mg/l, which indicates 71.9, 83.2, 97.5, 81.4 and 80.0% COD removal, and 64.8, 82.5, 98.5, 95.7, and 93.9% TOC removal from the PW. Thus, the simulation results inferred that HRT of 1.0 day (24 hours) is optimum for treating PW using the Bio-Unit system. These trends agree with similar publications . This implies that there is threshold below which the Bio-Unit performance was negated due to organic loading (F/M ratio) dynamics and to auto oxidation of the microorganisms, resulted from protracted HRT . Thus, HRT of 1.0 day (24 hours) was operationally and economically optimal for PW treatment using the Bio-Unit system. Several publications have demonstrated that, HRT of ≤ 24 hours encourages high performance of different types of activated sludge configurations treating different categories of wastewater .
3.3.3. Effect of Initial MLSS on the Performance of the Bio-Unit System
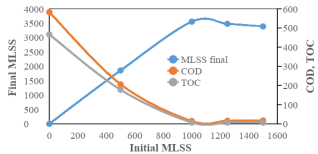
Figure 9. Effect of initial MLSS on the performance of the Bio-Unit system.
The simulation to analyze the effect of initial concentration of the microbial consortium on the Bio-Unit efficiency was conducted for MLSS of 500.0, 1000.0, 1250.0 and 1500.0 mg/l, while the BRT, and HRT were kept constant at 21 days, 1.00 days, respectively. The simulation as plotted in Figure 9 shows that, for MLSS of 500.0, 1000.0, 1250.0 and 1500.0 mg/l, the effluent COD were 206.3, 14.7, 16.2, and 17.7 mg/l, respectively, while the effluent TOC were 177.9, 7.02, 6.6, and 6.3 mg/l, respectively, indicating 64.6, 97.5, 97.2 and 97.0% removal of COD, and 61.8, 98.5, 98.6, and 98.6% removal of TOC, respectively. Thus, the simulation result showed that the Bio-Unit performed optimally at initial MLSS concentration of 1000.0 mg/l. The simulation results inferred that the initial MLSS concentration has significant effect on the Bio-Unit performance. High initial microbial concentration favors biodegradation of oil-laden and other related wastewater , though it can also impact negatively on system operations and economies . Also, high initial MLSS concentration increases particle size distribution of the activated sludge flocs, bacterial species richness and enhancement of microbial population diversity .
3.3.4. Effect of Varied Influent COD and TOC on the Performance of the Bio-Unit System
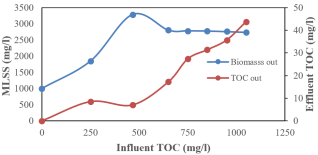
Figure 10. Effect of different influent TOC on the performance of the Bio-Unit system.
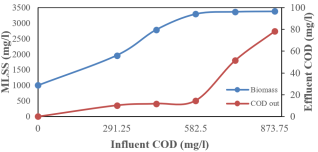
Figure 11. Effect of different influent COD on the performance of the Bio-Unit system.
The effect of influent concentration on the Bio-Unit system performance was studied by simulating the formulated model for different COD and TOC concentrations, while the BRT, HRT and MLSS were kept constant at 21 days, 1.0 day (24 hrs.) and 1000 – 1460 mg/l, respectively. The simulation results for COD as shown in Figure 10, illustrated that, for influent COD concentrations of 291.25, 436.875, 582.5, 728.125 and 873.75 mg/l, the effluent COD were 10.3 and 11.9, 14.7, 51.5 and 78.2 mg/l, respectively, thus achieving 96.4, 97.2, 97.5, 92.9, 91.1% removal of COD, respectively, from the PW. The simulation results for TOC as depicted in Figure 11 illustrated that, for influent TOC of 250.0, 466.1, 650.0, 750, 850.0, 950.0, and 1050.0 mg/l, the effluent TOC were 8.5, 7.02, 17.2, 27.4, 31.4, 35.7, and 43.8, respectively, thus achieving 96.9, 98.5, 97.4, 96.3, 96.3, 96.2, 95.8% removal of TOC, respectively, from the PW. The result implies that, increase in influent COD and TOC concentrations at constant MLSS, BRT and HRT, causes increase in effluent TOC and COD concentrations. Grady and Williams reported that influent substrate concentration has significant effect on the effluent concentration. Increasing the influent concentration results in an increased organic loading rate, which adversely affects the Bio-Unit system performance. Also, Figures 10 and 11 illustrate that MLSS concentration relapsed gradually to stationary growth, as influent concentrations were varied. The stagnated growth could be attributed to substrate overloading, which might have gradually overstretched the extant enzymatic prowess.
4 Conclusion
The capacity, reliability and performance of PW treatment technology are very critical for continuous oil and gas production, especially in mature oil and gas fields where the ratio of water to oil/gas (WOR) production is high. It is demanding to reconfigure the extant PW treatment plants with modular bio-oxidation unit (Bio-Unit) and formulate mathematical models predicting and simulating such bioprocess to achieve PW specifications for reinjection into well cuttings or disposal into the environment. In this work, mathematical models were developed to predict and simulate the behavior of an oilfield pilot scale modular bio-oxidation unit (Bio-Unit). The models were formulated from first principles of mass conservation and solved numerically using fourth-order Runge-Kutta algorithms in Matlab software. The formulated models were evaluated using the linear regression between experimental values from the pilot scale Bio-Unit system and the model predicted values. The best fit value, (R2) of 0.9923, 0.9890, and 0.9831, for chemical oxygen demand (COD), total organic carbon (TOC), and bioagents suspended solids (MLSS), respectively, demonstrate that the formulated model had a significant correlation with the pilot-scale Bio-Unit values and is 99.2%, 98.9%, and 98.3% dependable in predicting the parameters. The mean bias error (MBE) was -3.67, 4.79 and 3.24, for the predicted MLSS, COD and TOC concentrations, respectively, which shows that the model under-predicted the MLSS, while the COD and TOC concentrations were over-predicted. The model predicted values had 4.3%, 3.1% and 7.9% for COD, TOC, and MLSS, respectively, from the Bio-Unit experimental values. The effect of process parameters such as biosolid retention time (BRT), hydraulic retention time (HRT), and initial bioagents suspended solids (MLSS) on the Bio-Unit system performance was simulated using the formulated models. The simulation demonstrated that 21 days BRT and 1 day (24 hours) HRT favoured the system efficiency and enhanced effluent PW quality. Hence, the formulated models are adequate and reliable for predicting and optimizing the Bio-Unit system.
Abbreviations

APHA

American Public Health Association

ASM1

Activated Sludge Model No. 1

ASTM

American Society for Testing and Materials

ASP

Activated Sludge Process

b

Endogenous Decay Rate Constant (1/h)

bh

Endogenous Decay Rate of Heterotrophic Biomass (h-1)

BOD

Biological Oxygen Demand

BRT

Biosolid Retention Time

C

Time Varying Concentration of Component of Interest (mg/l)

Cin

Inlet Concentration (mg/l)

COD

Chemical Oxygen Demand

DO

Dissolved Oxygen

HRT

Hydraulic Retention Time

km

Maximum Specific Substrate Utilization Rate (1/day)

KS

Half Saturation Coefficient (mg/l)

KSCOD

Saturation Coefficient of Chemical Oxygen Demand (mg/l)

MLSS

Bioagent Suspended Solids

O&G

Oil and Grease Concentration

PW

Produced Water

PWTP

Produced Water Treatment Plant

q

Flow Rate of Component, (l/h)

qin

Inlet Flow Rate (l/h)

qout

Outlet Flow Rate (l/h)

rC

Reaction Rate of the Component

rCI

Net rate of Generation/Consumption of Component I, (mg/l.h)

rd

Endogenous Decay Rate, (1/h)

rg

Bioagent Growth Rate, (mg/l.h)

rS

Substrate Consumption Rate

rSCOD

Rate of Chemical Oxygen Demand Utilization

rX

Net Growth Rate

S

Rate Limiting Substrate Concentration (mg/l)

SBR

Sequencing Batch Reactor

STOC

Total Organic Carbon concentration (mg/l)

t

Time, (h)

TDS

Total Dissolved Solids

THC

Total Hydrocarbon Content

TPH

Total Petroleum Hydrocarbon

TOC

Total Organic Carbon

TSS

Total Suspended Solids

V

Reactor Volume (l)

V0

Initial Volume (l)

X

Bioagent Concentration (mg/l)

Xh

Heterotrophic Bacteria Concentration (mg/l)

Y

Yield Coefficient (mg MLSS/mg substrate)

β

Cycle Fraction for Fill and React Period

θ

Hydraulic Retention Time, HRT

θc

Biosolid Retention Time, BRT

τ

Effective Biosolids Retention Time

μ

Specific Growth Rate (1/h)

μm

Maximum Specific Rate of Growth Constant (1/h)

μm,

Maximum Specific Rate Growth for Heterotrophic Bacteria (mg/l)

ρj

Net Expression for Process j, mg/l.h

ϑ

Effective Hydraulic Retention Time for SBR

ϑCIj

Stoichiometric Coefficient Relating Process j to Component I

Author Contributions
Darlington Bon Nwokoma: Conceptualization, Formal Analysis, Investigation, Methodology, Resources, Visualization, Writing – original draft
Kenneth Kekpugile Dagde: Conceptualization, Formal Analysis, Resources, Supervision, Validation, Writing – review & editing
Conflicts of Interest
The authors declare that they have no known competing financial interests or personal relationships that could have appeared to influence the work reported in this paper.
References
[1] McCabe, P. J. “Oil and Natural Gas: Global Resources”, Fossil Energy, pp. 5-16, 2020.
[2] Fukhru’l-Razi, A., Pendashteh, A., Abdullah, L. C., Biak, D. R. A, Madaeni, S. S., Abidin, Z. Z. “Review of technologies for oil and gas produced water treatment”, Journal of Hazardous Materials, 170, pp. 530-551, 2009.
[3] Igunnu, E. T., Chen, G. Z. “Produced water treatment technologies”, International Journal of Low-Carbon Technologies, 9(3), pp. 157-177, 2014.
[4] Nonato, T. C. M., Alves, A. A. D., Sens, M. L., Dalsasso, R. L. “Produced water from oil – A review of the main treatment technologies”, Journal of Environmental Chemistry and Toxicology, 2(1) pp. 23-27, 2018.
[5] Nie, H., Nie, M., Diwu, Z., Wang, L., Yan, H., Lin, Y., Zhang, B., Wang,Y. “Biological treatment of high salinity and low pH produced water in oilfield with immobilized cells of P. aeruginosa NY3 in a pilot-scale”, Journal of Hazardous Materials, 381, pp. 1-6, 2020.
[6] Dawoud, H. D., Saleem, H., Alnuaimi, N. A., Zaidi, S. J. “Characterization and Treatment Technologies Applied for Produced Water in Qatar”, Water 13, (3573), pp. 1-39, 2021.
[7] Amakiri, K. T., Canon, A. R., Molinari, M., Angelis-Dimakis, A. “Review of oilfield produced water treatment technologies”, Chemosphere, 298, 2022.
[8] Nwokoma, D. B., Dagde, K. K. “Performance Evaluation of Produced Water Quality from a Nearshore Oil Treatment Facility”, Journal of Applied Sciences and Environmental Management, 16(1) pp. 27-33, 2012.
[9] International Association of Oil and Gas Producers (OGP). “Aromatics in Produced water: Occurrence, fate & effects, and treatment”, Report No. 1.20/324, pp. 1-25, 2002.
[10] Tellez, G. T., Nirmalakhandan, N., Gardea-Torresdey, J. L. “Performance of an activated sludge system for removing petroleum hydrocarbons from oilfield produced water”, Advances in Environmental Research, 6(4), pp. 455-470, 2002.
[11] Tellez, G. T., Nirmalakhandan, N., Gardea-Torresdey, J. L. “Kinetic Evaluation of a Field-Scale Activated Sludge System for Removing Petroleum Hydrocarbons from Oilfield-Produced Water”, Environmental Progress, 24(1), pp. 96-104, 2005.
[12] Li, Q., Kang, C., Zhang, C. “Wastewater produced from an oilfield and continuous treatment with an oil-degrading bacterium”, Process Biochemistry,40(2), pp. 873–877, 2005.
[13] Dong, Z., Lu, M., Huang, W., Xu, X. “Treatment of oilfield wastewater in moving bed biofilm reactors using a novel suspended ceramic biocarrier”, Journal of Hazardous Materials, 192, pp. 123-130, 2011.
[14] Camarillo, M. K., Stringfellow, W. T. “Biological Treatment of oil and gas produced water: a review and meta- analysis”, Clean Technologies and Environmental Policy, 20(6), pp. 1-28, 2018.
[15] Lusinier, N., Syessiecq, I., Sambusiti, C., Jacob, M., Lesage, N., Roche, N. “Biological Treatments of Oilfield Produced Water: A Comprehensive Review”, SPE Journal, 24(05), pp. 1-13, 2019.
[16] Abass, A. O. “Recent advances on the treatment technology of oil and gas produced water for sustainable energy industry-mechanistic aspects and process chemistry perspectives”, Chemical Engineering Journal Advances, 4, pp. 1- 25, 2020.
[17] Abuhasel, K., Kchaou, M., Alquraish, M., Munusamy, Y., Jeng, Y. T. “Oily Wastewater Treatment: Overview of Conventional and Modern Methods, Challenges, and Future Opportunities”, Water, 13(980), pp. 1-35, 2021.
[18] Adetunji, A. I., Olaniran, A. O. “Treatment of industrial oily wastewater by advanced technologies: a review”, Applied Water Science, 11(98), 2021.
[19] Amakiri, K. T., Ogolo, N. A., Angelis-Dimakis, A., Albert, O. “Physicochemical assessment and treatment of produced water: A case study in Niger delta Nigeria”, Petroleum Research, 8, pp. 87-95, 2023.
[20] Dai, P-Y., Liu, Y-Q., Lu, H., Li, Y-D., Yang, Q. “Produced-Water treatment: Application and Research of combined fiber coalescence technique in offshore oilfield”, Petroleum Science, 20(1), pp. 569-576, 2023.
[21] Al Dawery, S. K., Al-Sawai, M. K., Al Muzami, G. M. S., Annamareddy, S. H. K., Al Dawari, M. S., Harharah, R. H., Harharah, H. N., Amari, A. “Treatment of Produced Water Using Prepared Activated Carbon-Based Sewage Sludge”, Separations 10(10), 519, 2023.
[22] Akinsete, O. O, Agbabi, P. O., Akinsete, S. J., Ipeaiyeda, A. R. “Comparative study of improved treatment of oil produced water using pure and chemically impregnated activated carbon of banana peels and Luffa cylindrica”, African Journal of Environmental Science and Technology, 6(12), pp. 422-431, 2022.
[23] Udeagbara, S. G., Isehunwa, S. O., Okereke, N. U., Oguamah, I. U. “Treatment of produced water from Niger Delta oil fields using simultaneous mixture of local materials”, Journal of Petroleum Exploration and Production, 11, pp. 289-302, 2021.
[24] Oyedoh, E. A., Adam-Urete, A. L. “Degradation of Total Hydrocarbon Content of Oilfield Produced Water using Activated Cow Bone Carbon”, Journal of Chemical Society of Nigeria. 48(2), pp. 358-373, 2023.
[25] Yousef, R., Qiblawey, H., El-Naas, M. H. “Adsorption as a Process for Produced Water Treatment: A Review”, Processes 8 (12), 1657, 2020.
[26] Das, N., Rajput, H., Aly Hassan, A., Kumar, S. “Application of Different Coagulants and Cost Evaluation for the Treatment of Oil and Gas Produced Water”, Water, 15, 464, 2023.
[27] Odisu, T., Basikoro, A. “Development and Application of a Bio-Coagulant using Plantain Pseudo Stem Extract for Crude Oil-Field Produced Water Treatment”, Nigerian Research Journal of Engineering and Environmental Sciences, 9(1), pp. 235-248, 2024.
[28] Zolghadr, E., Firouzjaei, M. D., Amouzandeh, G., LeClair, P., Elliott, M. “The Role of Membrane-Based Technologies in Environmental Treatment and Reuse of Produced Water”, Frontiers in Environmental Science, 9, 2021.
[29] Guo, C., Chang, H., Liu, B., He, Q., Xiong, B., Kumar, M., Zydney, A. L. “A combined ultrafiltration–reverse osmosis process for external reuse of Weiyuan shale gas flowback and produced water”, Environmental Science: Water Research and Technology, 4(7), pp. 942-955, 2018.
[30] Zhanga, H., Gaoc, C., Zhanga, H., Songa, N., Caoa, Q. “Recent advances on the treatment of oilfield- produced water by advanced oxidation processes: A review”, Water Reuse, 14(2), pp. 190-207, 2024.
[31] Shamshad, J., Rehman, R. U., “Innovative approaches to sustainable wastewater treatment: a comprehensive exploration of conventional and emerging technologies”, Environmental Science: Advances, 4, pp. 189-222, 2025.
[32] Abdelhamid, C., Latrach, A., Rabiei, M., Venugopal, K. “Produced Water Treatment Technologies: A Review”, Energies 18(63), pp. 1-23, 2025.
[33] Rajbongshi, A., Gogoi, S. B. “A review on oilfield produced water and its treatment technologies”, Petroleum Research, 9, pp. 640-656, 2024.
[34] Poornima, S., Manikandan, S., Karthik, V., Balachandar, R., Subbaiya, R.., Saravanan, M. et al. “Emerging nanotechnology based advanced techniques for wastewater treatment”, Chemosphere, 303, 135050, 2022.
[35] Kuyukina, M. S., Krivoruchko, A. V., Ivshina, I. B. “Advanced Bioreactor Treatments of Hydrocarbon-Containing Wastewater”, Applied Sciences, 10, 831, pp. 1-19, 2020.
[36] Yu, L., Han, M., He, F. “A review of treating oily wastewater, Arabian Journal of Chem., 10, pp. 1913-1922, 2017.
[37] Seyed, M. A. O., Fallah, N., Nasernejad, B. “Biological treatment of organic compounds in produced water with use of halotolerant bacteria”, Journal of Environmental Chemical Engineering, 8(6), 2020.
[38] Alsarayreh, M., Almomani, F., Khraisheh, M., Nasser, M. S., Soliman, Y. “Biological-Based Produced Water Treatment Using Microalgae: Challenges and Efficiency”, Sustainability, 14(499), pp. 1-32, 2022.
[39] Xu, X., Liu, W., Tian, S., Wang, W., Qi, Q., Jiang, P., Gao, X., Li, F., Li, H. Yu, H. “Petroleum Hydrocarbon- Degrading Bacteria for the Remediation of Pollution Under Aerobic Conditions: A Perspective Analysis”, Frontiers in Microbiology, 9, pp. 1-11, 2018.
[40] Akpoka, O. A., Erifeta, G. O., Imade, O. S., Okafor-Elenwo, E. J., Enaigbe, A. A., Abolarin, D. S. “Isolation and Characterization of Crude Oil Degrading Bacteria in Association with Microalgae in Saver Pit from Egbaoma Flow Station, Niger Delta, Nigeria”, Archives of Ecotoxicology, 2(2), pp. 12-16, 2020.
[41] Edet, U. O., Bassey, U. I., Asitok, A. D., Anika, O. C., Egbomuche, R. C., Ekiso, J., Ejelonu, V. O., Umoafia, N. G. E. “Isolation and Characterization of Crude Oil Degrading Fungi Isolates from Soil Samples from Niger Delta”, International Journal of Innovative Science and Research Technology, 5(1), pp. 697-700, 2020.
[42] Araújo, W. J., Oliveira, J. S., Araújo, S. C. S., Minnicelli, C. F., Silva-Portela, R. C. B., da Fonseca, M. M. B.,.… Agnez-Lima, L. F. “Microbial Culture in Minimal Medium with Oil Favors Enrichment of Biosurfactant Producing Genes”, Frontiers in Bioengineering Biotechnology, 8(962), pp. 1-16, 2020.
[43] Acharya, S. M., Chakraborty, R., Tringe, S. G. “Emerging Trends in Biological Treatment of Wastewater from Unconventional Oil and Gas Extraction”, Frontiers in Microbiology, 11: 569019, 2020.
[44] Abujayyab, A. M., Hamouda, M., Hassan, A. A. “Biological treatment of produced water: A comprehensive review and metadata analysis”, Journal of Petroleum Science and Engineering, 209, pp. 11-23, 2022.
[45] Azeez, R. A., Al-Zuhairi, F. A. “Bio-Treatment Technologies of Produced Water: A Review”, Engineering and Technology Journal, 40(9), pp. 1216-1230, 2022.
[46] Kardena, E., Hidayat, S., Nora, S., Helmy, Q. “Biological Treatment of Synthetic Oilfield-Produced Water in Activated Sludge Using a Consortium of Endogenous Bacteria Isolated from A Tropical Area”, Journal of Petroleum and Environmental Biotechnology, 8(3), pp. 1-7, 2017.
[47] Pendashteh, A. R., Fakhru’l-Razi, A., Chuah, T. G., Radiah, A. D., Madeeni, S. S., Zurina, Z. A. “Biological treatment of produced water in a sequencing batch reactor by consortium of isolated halophilic microorganisms”, Environmental Technology, 31(11), pp. 1229-1239, 2010.
[48] Fukhru’l-Razi, A., Pendashteh, A., Abdullah, L. C., Biak, D. R. A., Madaeni, S. S., Abidin, Z. Z. “Application of membrane-coupled sequencing batch reactor for oilfield produced water recycle and beneficial re-use”, Bioresource Technology, 101(18), pp. 6942-6949. 2010.
[49] Khairuddin, N. F. M., Khan, N., Sankaran, S., Farooq, W., Ahmad, I., Aljundi, I. H. “Produced water treatment by semi-continuous sequential bioreactor and microalgae photobioreactor”, Bioresouces and Bioprocessing, 11(56), pp. 1-13, 2024.
[50] Nwokoma, D. B., Dagde, K. K. “Niger Delta Oilfields Produced Water Characteristics and Treatment Technologies: Challenges and Solutions”, American Journal of Chemical Engineering, 12(4), pp. 97-108, 2024.
[51] Alsaeed, R. D., Aldarwish, A. Q., Khouri, L., Kolluru, V. “Response surface modeling of sodium hypochlorite-based manganese oxidation in drinking water”, DYSONIA-Applied Science, 6(2), pp. 334-342, 2025.
[52] Nwokoma, D. B., Dagde, K. K. “Microbial Detoxification of Oilfield Produced Water Using Discontinuous Bio-Unit System”, American Journal of Chemical Engineering, 11(5), pp. 95-105, 2023.
[53] Nwokoma, D. B., Dagde, K. K., Akpa, J. G., Ehirim, E. “Biokinetic Study of Microbial Decontamination of Oilfield Produced Water”, International Journal of Chemical and Process Engineering Research, 9(1), pp. 11-20, 2022.
[54] Gu, T., Rastegar, S. O., Mousavi, S. M., Li, M., Zhou, M. “Advances in bioleaching for recovery of metals and bioremediation of fuel ash and sewage sludge”, Bioresource Technology, 261, pp. 428-440, 2018.
[55] Mohan, S. V., Rao, N. C., Prasad, K. K., Madhavi, B. T. V., Sharma, P. N. “Treatment of complex chemical wastewater in a sequencing batch reactor (SBR) with an aerobic suspended growth configuration”, Process Biochemistry, 40(5), pp. 1501-1508, 2005.
[56] Department of Petroleum Resources (DPR), Environmental Guidelines and Standards for the Petroleum Industry in Nigeria, EGASPIN, Ministry of Petroleum Resources, Lagos. 1991, 1999, 2018.
[57] Lusinier, N., Seyssiecq, I., Sambusiti, C., Jacob, M., Lesage, N., Roche, N. “A comparative study of conventional activated sludge and fixed bed hybrid biological reactor for oilfield produced water treatment: Influence of hydraulic retention time”, Chemical Engineering Journal, 420(2), 2021.
[58] Leu, S.-Y., Chan, L., Stenstrom, M. K. “Toward Long Solids Retention Time of Activated Sludge Processes: Benefits in Energy Saving, Effluent Quality, and Stability”, Water Environmental Research, 84, pp. 42-53, 2012.
[59] Reece, C. S., Roper Jr, R. E., Grady Jr, C. P. “Aerobic Digestion of Waste Activated Sludge”, Journal of Environmental Engineering, 105, pp, 261-272, 1979.
[60] Rittman, B. E., McCarty, P. L. Environmental Biotechnology: Principles and Applications, McGraw-Hill, Columbus, OH. 2001.
[61] Fan, H., Liu, X., Wang H., Han, Y., Qi, L., Wang, H. “Oxygen transfer dynamics and activated sludge floc structure under different sludge retention times at low dissolved oxygen concentrations”, Chemosphere, 169, pp. 586–595, 2017.
[62] Elmolla, E. S., Ramdass, N., Chaudhuri, M. “Optimization of Sequencing Batch Reactor Operating Conditions for Treatment of High-strength Pharmaceutical Wastewater”, Journal of Environmental Science and Technology, 5, pp. 452-459, 2012.
[63] Sarkar, M., Sangal, V. K., Bhunia, H. “Hydrodynamics and parameter Study of an activated sludge process using residence time distribution technique”, Environmental Engineering Research, 25(3), pp. 400-408, 2020.
[64] Dan, N. P., Visvanathan, C., Basu, B. “Comparative evaluation of yeast and bacterial treatment of high salinity wastewater based on biokinetic coefficients”, Bioresource. Technology, 87, pp. 51-56, 2003.
[65] Barr, T. A., Taylor, J. M., Duff, S. J. B. “Effect of HRT, SRT and temperature on the performance of activated sludge reactors treating bleached kraft mill effluent”, Water Research, 30(4), pp. 799-810, 1996.
[66] Shariati, S. R., Bonakdarpour, B., Zare, N., Ashtiani, F. Z. “The effect of hydraulic retention time on the performance and fouling characteristics of membrane sequencing batch reactors used for the treatment of synthetic petroleum refinery wastewater”. Bioresource Technology, 102(17), pp. 7692-7699, 2011.
[67] Xu, S., Wu, D., Hu, Z. “Impact of hydraulic retention time on organic and nutrient removal in a membrane coupled sequencing batch reactor, Water Research, 55 pp. 12-20, 2014.
[68] Affam, A. C. “Effect of hydraulic retention time on nutrients and organics removal by FeGAC/H2O2-SBR treatment of pesticide wastewater”, Desalination and Water Treatment, 195, pp. 297-304, 2020.
[69] Wang, X., Li, J., Zhang, X., Chen, Z., Shen, J., Kang, J. “Impact of hydraulic retention time on swine wastewater treatment by aerobic granular sludge sequencing batch reactor”, Environmental Science and Pollution Research, 28(5), pp. 5927-5937, 2021.
[70] Cisterna, P. “Biological Treatment by Active Sludge with High Biomass Concentration at Laboratory Scale for Mixed Inflow of Sunflower Oil and Saccharose”, Environments, 4(69), pp. 1-13, 2017.
[71] Tian, X., Shangli, G., Kaicheng, X., Chunling, Z., Xuefeng, W., Dejun, B. “Effect of mixed liquor suspended solids (MLSS) on simultaneous nitrification and denitrification in a sequencing batch reactor”, IOP Conference Series: Earth and Environmental Science, 186, pp. 1-6, 2018.
[72] Schwarz, A. O., Rittmann, B. E., Crawford, G. V., Klein, A. M., Daigger, G. T. “Critical Review on the Effect of Mixed liquor suspended solids on Membrane Bioreactor Operation”, Separation Science and Technology, 41(7), pp. 1489-1511, 2006.
[73] Yan, X., Dongli, G., Dezhi, Q., Shikan, Z., Mengke, J., Mengjiao, Z., Jingjing, L., Xianfa, S., Jianhui, S. “Effect of mixed liquor suspended solid concentration on nitrous oxide emission from an anoxic/oxic sequencing bioreactor”, Desalination and Water Treatment, 163, pp. 48–56, 2019.
[74] Grady, C. P. L., Williams, D. R. “Effects of influent substrate concentration on the kinetics of natural microbial populations in continuous culture”, Water Research, 9(2), pp. 171-180, 1975.
Cite This Article
  • APA Style

    Nwokoma, D. B., Dagde, K. K. (2026). Mathematical Modeling of Bio-Unit System for Oilfield Produced Water Treatment. American Journal of Chemical Engineering, 14(2), 29-44. https://doi.org/10.11648/j.ajche.20261402.12

    Copy | Download

    ACS Style

    Nwokoma, D. B.; Dagde, K. K. Mathematical Modeling of Bio-Unit System for Oilfield Produced Water Treatment. Am. J. Chem. Eng. 2026, 14(2), 29-44. doi: 10.11648/j.ajche.20261402.12

    Copy | Download

    AMA Style

    Nwokoma DB, Dagde KK. Mathematical Modeling of Bio-Unit System for Oilfield Produced Water Treatment. Am J Chem Eng. 2026;14(2):29-44. doi: 10.11648/j.ajche.20261402.12

    Copy | Download

  • @article{10.11648/j.ajche.20261402.12,
      author = {Darlington Bon Nwokoma and Kenneth Kekpugile Dagde},
      title = {Mathematical Modeling of Bio-Unit System for Oilfield Produced Water Treatment},
      journal = {American Journal of Chemical Engineering},
      volume = {14},
      number = {2},
      pages = {29-44},
      doi = {10.11648/j.ajche.20261402.12},
      url = {https://doi.org/10.11648/j.ajche.20261402.12},
      eprint = {https://article.sciencepublishinggroup.com/pdf/10.11648.j.ajche.20261402.12},
      abstract = {The Nigerian oil and gas extraction faces the challenge of treating excessive co-extracted Produced Water (PW) to fulfil reinjection or disposal specifications. Deploying a proposed modular bio-oxidation system (Bio-Unit) to treat PW necessitates predictive model for this biotreatment process. Thus, this work aimed at formulating mathematical models for predicting and simulating the Bio-Unit system. Experimentally determined biokinetic coefficients and other operating parameters were incorporated into the developed models and integrated numerically using fourth-order Runge-Kutta algorithm. Model predicted values of outlet chemical oxygen demand (COD), total organic carbon (TOC), and bioagent suspended solids (MLSS) were 14.7 mg/l, 7.02 mg/l, and 3252.0 mg/l, respectively. The percentage deviation of model predicted values from measured values was 4.3%, 3.1% and 7.9% for COD, TOC and MLSS, respectively. Linear regression between measured values and model predicted values gave the best fit value (R2) of 0.9923, 0.9890, and 0.9831 for COD, TOC, and MLSS, respectively, which indicates that the formulated model had a significant correlation with the Bio-Unit data and is 99.2%, 98.9%, and 98.3% dependable in predicting the parameters. The mean bias error for predicted MLSS, COD and TOC concentrations were -3.67, 4.79 and 3.24, respectively, which indicates that the model under-predicted the MLSS, while the COD and TOC concentrations were over-predicted. Model simulation showed that biosolid retention time of 21 days and hydraulic retention time of 1.0 day resulted in 98.3% and 98.5% COD and TOC removal. Hence, the formulated models are adequate and recommended for predicting and optimizing the Bio-Unit system.},
     year = {2026}
    }
    

    Copy | Download

  • TY  - JOUR
    T1  - Mathematical Modeling of Bio-Unit System for Oilfield Produced Water Treatment
    AU  - Darlington Bon Nwokoma
    AU  - Kenneth Kekpugile Dagde
    Y1  - 2026/04/23
    PY  - 2026
    N1  - https://doi.org/10.11648/j.ajche.20261402.12
    DO  - 10.11648/j.ajche.20261402.12
    T2  - American Journal of Chemical Engineering
    JF  - American Journal of Chemical Engineering
    JO  - American Journal of Chemical Engineering
    SP  - 29
    EP  - 44
    PB  - Science Publishing Group
    SN  - 2330-8613
    UR  - https://doi.org/10.11648/j.ajche.20261402.12
    AB  - The Nigerian oil and gas extraction faces the challenge of treating excessive co-extracted Produced Water (PW) to fulfil reinjection or disposal specifications. Deploying a proposed modular bio-oxidation system (Bio-Unit) to treat PW necessitates predictive model for this biotreatment process. Thus, this work aimed at formulating mathematical models for predicting and simulating the Bio-Unit system. Experimentally determined biokinetic coefficients and other operating parameters were incorporated into the developed models and integrated numerically using fourth-order Runge-Kutta algorithm. Model predicted values of outlet chemical oxygen demand (COD), total organic carbon (TOC), and bioagent suspended solids (MLSS) were 14.7 mg/l, 7.02 mg/l, and 3252.0 mg/l, respectively. The percentage deviation of model predicted values from measured values was 4.3%, 3.1% and 7.9% for COD, TOC and MLSS, respectively. Linear regression between measured values and model predicted values gave the best fit value (R2) of 0.9923, 0.9890, and 0.9831 for COD, TOC, and MLSS, respectively, which indicates that the formulated model had a significant correlation with the Bio-Unit data and is 99.2%, 98.9%, and 98.3% dependable in predicting the parameters. The mean bias error for predicted MLSS, COD and TOC concentrations were -3.67, 4.79 and 3.24, respectively, which indicates that the model under-predicted the MLSS, while the COD and TOC concentrations were over-predicted. Model simulation showed that biosolid retention time of 21 days and hydraulic retention time of 1.0 day resulted in 98.3% and 98.5% COD and TOC removal. Hence, the formulated models are adequate and recommended for predicting and optimizing the Bio-Unit system.
    VL  - 14
    IS  - 2
    ER  - 

    Copy | Download

Author Information